M/E Wagner developed a data acquisition system that logs real-time crankcase pressure measurements, enabling us to do a comparison of several stock PCV valves with our Dual Flow® PCV valve.

All data was logged with a laptop during actual on-highway driving. Driving conditions were varied from light, moderate to heavy throttle identically for each test. The test route was a 17 mile round trip consisting of uphill, downhill and flat sections of road. The same test was performed twice for each valve, and the results averaged. Each test showed excellent consistency from Test 1 to Test 2. Full testing details can be seen below.
TESTING RESULTS – SUMMARY
The most basic metric of evaluating a PCV valve’s performance is how effectively it evacuates the crankcase of blowby under a variety of driving conditions. When a PCV valve flows the proper amount of air, it will evacuate blowby from the crankcase and draw fresh air into the crankcase through the valve cover breather During this condition, a slight vacuum is present in the crankcase. This slight vacuum is also helpful in preventing oil leaks.
When the engine produces more blowby than the PCV valve can handle, the blowby gasses find their way out through the valve cover breather. In this condition, the crankcase is under a slight amount of pressure, and no fresh air is drawn into the crankcase. This pressure is detrimental for oil leaks, but also indicates a more serious problem is present, the crankcase is not being properly evacuated. The acids and moisture present in the blowby are not being cleaned from your crankcase under this condition.

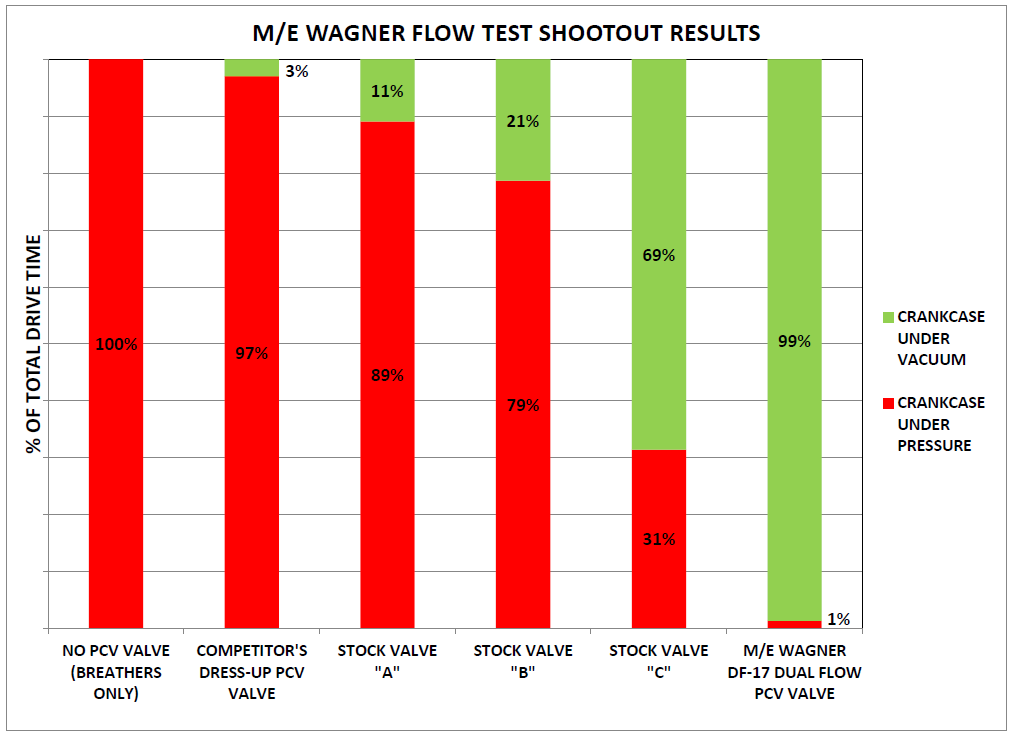
Our data acquisition system logged crankcase pressure vs. engine vacuum while driving using high precision pressure transducers. The table and graph above shows an average of how often the crankcase was under pressure (not effectively ventilated) vs. under vacuum (properly ventilated). As expected, running only breathers yielded a crankcase that was under pressure 100% of the time. Selecting a dress-up valve or a stock valve not specifically intended for the vehicle yielded mixed results. The M/E Wagner Dual Flow PCV Valve far outperformed any other valve tested, since it was properly tuned to the specific vehicle. (The 1% of the time the Dual Flow valve left the crankcase under pressure was under full throttle conditions where manifold vacuum is zero, this limitation is inherent to any PCV system.)
We won’t name names with the competitor’s dress-up valve we tested, however we will mention that we have observed this particular valve on a number of cars at car shows. It isn’t a coincidence that many of these vehicles had a pool of oil or a towel around the opposite valve cover breather to mop up the excess blowby being constantly forced out.
An interesting note is that all three stock valves tested had exactly the same physical outer dimensions! All valves were listed as compatible with one or more V8 applications from the manufacturer, we did not test with 4 or 6 cylinder only valves to make the results fair. As can be seen from the results, the flow performance can vary greatly depending on which stock valve you happen to pick, as well as which valve happens to be compatible with your engine’s vacuum profile.
TESTING RESULTS – DETAILS

The chart above shows the average over both tests for the integral (or area) under the pressure vs. time curve. The curve was split into areas that were above zero and below zero and integrated separately, so the pressure integrals did not cancel out the vacuum integrals.
This information can be used to determine to what degree the crankcase was under pressure or vacuum. For example, a valve that kept the crankcase under a low amount of pressure would have a low pressure integral (undesirable). A valve that kept the crankcase under a high amount of pressure would have a high pressure integral (even more undesirable). A valve that only moderately kept the crankcase under vacuum would have a low vacuum integral. A valve that kept the crankcase well under vacuum would have a higher vacuum integral (desirable, indicates proper ventilation).
The “under pressure” integral is proportional to how much blowby was forced out of the breather during the drive cycle, while the “under vacuum” integral is proportional to how much fresh air was drawn through the crankcase during the drive cycle.

The chart above shows full details of the testing data. This data was used to generate the averages displayed in the color coded graphs above. It can be observed from this data that over multiple tests, the same valve produced very similar results from test to test. This validates the consistency of the testing methods.
EXPERIMENTAL SETUP
Test Route
- 17 mile round trip drive for each “Test” listed above
- Mix of uphill, downhill and flat roadway
- Testing was primarily highway driving, with a small amount of stop and go and idling
- Driving habits varied between light, partial and full throttle, with effort to maintain consistent driving style between all tests
Test Vehicle
- 1965 Ford Falcon Sedan Delivery
- 331 Stroked Small Block (stroked 302)
- 9.97:1 Compression Ratio
- 650 Edelbrock 4 Barrel Carbuertor
- Crane custom grind hydraulic roller cam:
.480″/.498″ lift, .218/.220 duration @ .050, 106 LSA - Edelbrock Performer 289 Intake
- Edelbrock Performer RPM Heads
- Exhaust – Hedman headers
- MSD Ignition
- 4 Speed T-10 Transmission
- 3.25:1 Gears
M/E Wagner PCV Valve Tuning
- Used standard DF-17 PCV Valve without any modifications
- Tuned Dual Flow valve to flow specifications in manual based on engine size and idle vacuum level
- Utilized Dual Flow tuning mode with high vacuum spring